2021 By the Numbers
Race
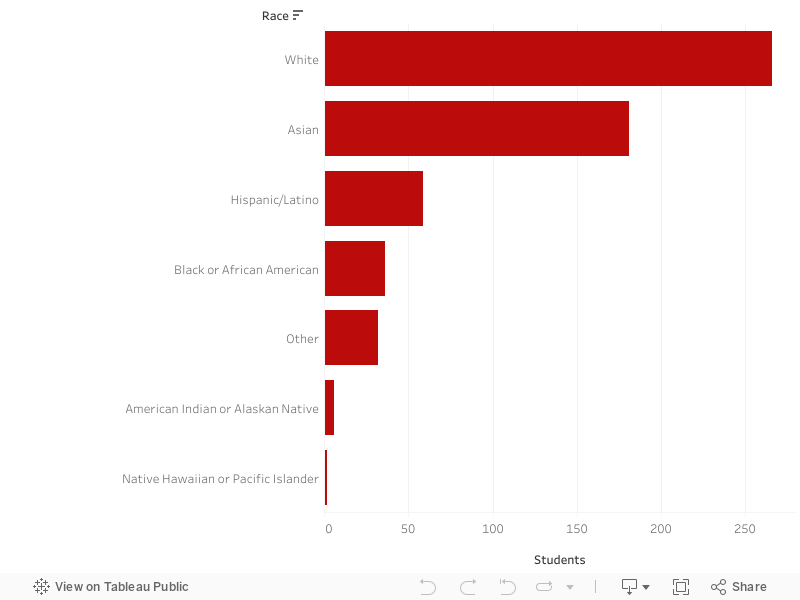

The graph above shows the reported races of the people whose responses we’ve used to assemble our data. The reported representation of each race here tends to mirror the races that Cornell reported for the Class of 2021 — mostly white, then Asian, Hispanic, black, and so on.
Since the Class of 2021 settled into Cornell’s campus in August, at least two large racial protests with hundreds of people each have emerged due in part to the Collegetown beating of a black student, a possible hate crime that has become national news. Race is frequently a topic of discussion at Cornell, whether in humanities classrooms or among guest speakers, but for some members of the Class of 2021, racial awareness and conversation may be a defining feature of their Cornell experience to this point.
Gender
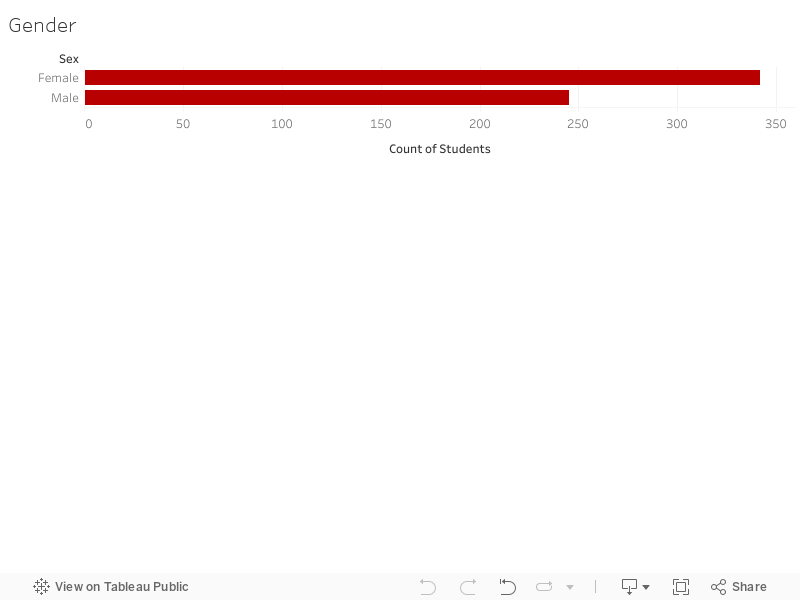
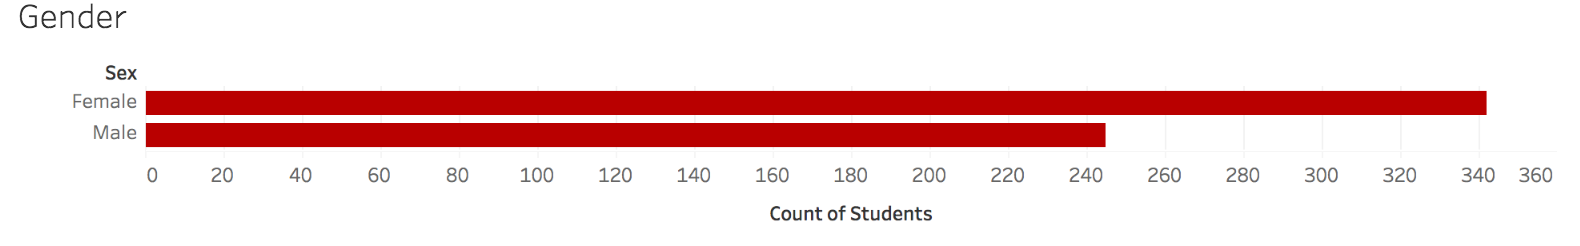
About 100 more women than men contributed to the data we used in this survey, and these survey results should be viewed in light of that finding. Cornell reports having about 196 more women than men in the Class of 2021, but since we didn’t survey the entire 3,375-person class, our results indicate skew.
Household Income Groups
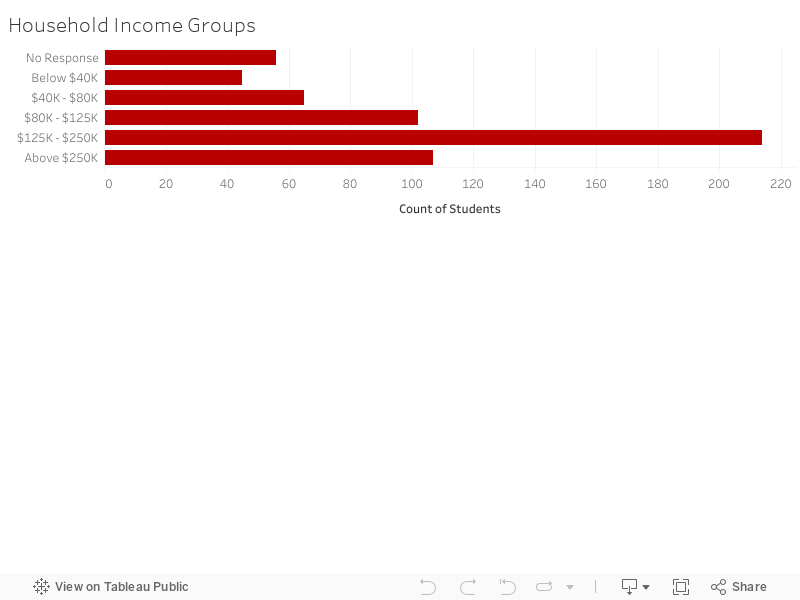
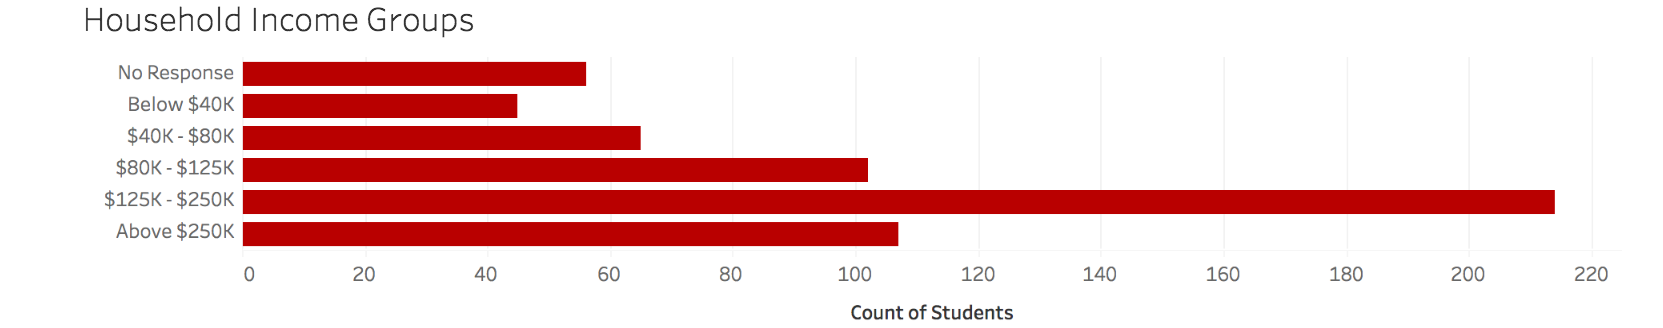
In January, The Sun reported that 1 in 10 Cornell students comes from the top one percent income level. While our survey did not ask specifically for income percentiles, our respondents indicated similarly high income levels, and considering the United States’s average yearly household income in 2016 was $59,039, it remains apparent that the average Cornellian comes from a strong financial background. In fact, 60 percent of respondents who answered this question and whose answers were not cut indicated that their households earn at least $125,000 annually.
Financial Aid and Household Income
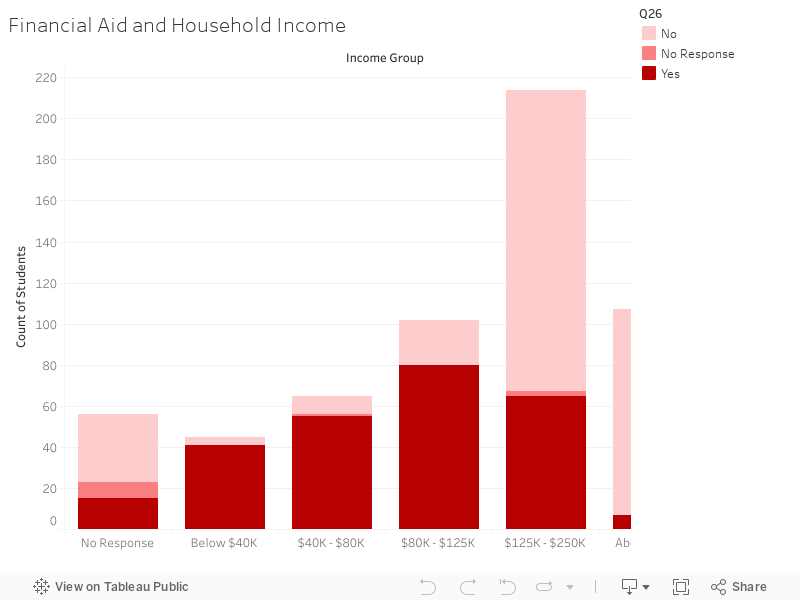
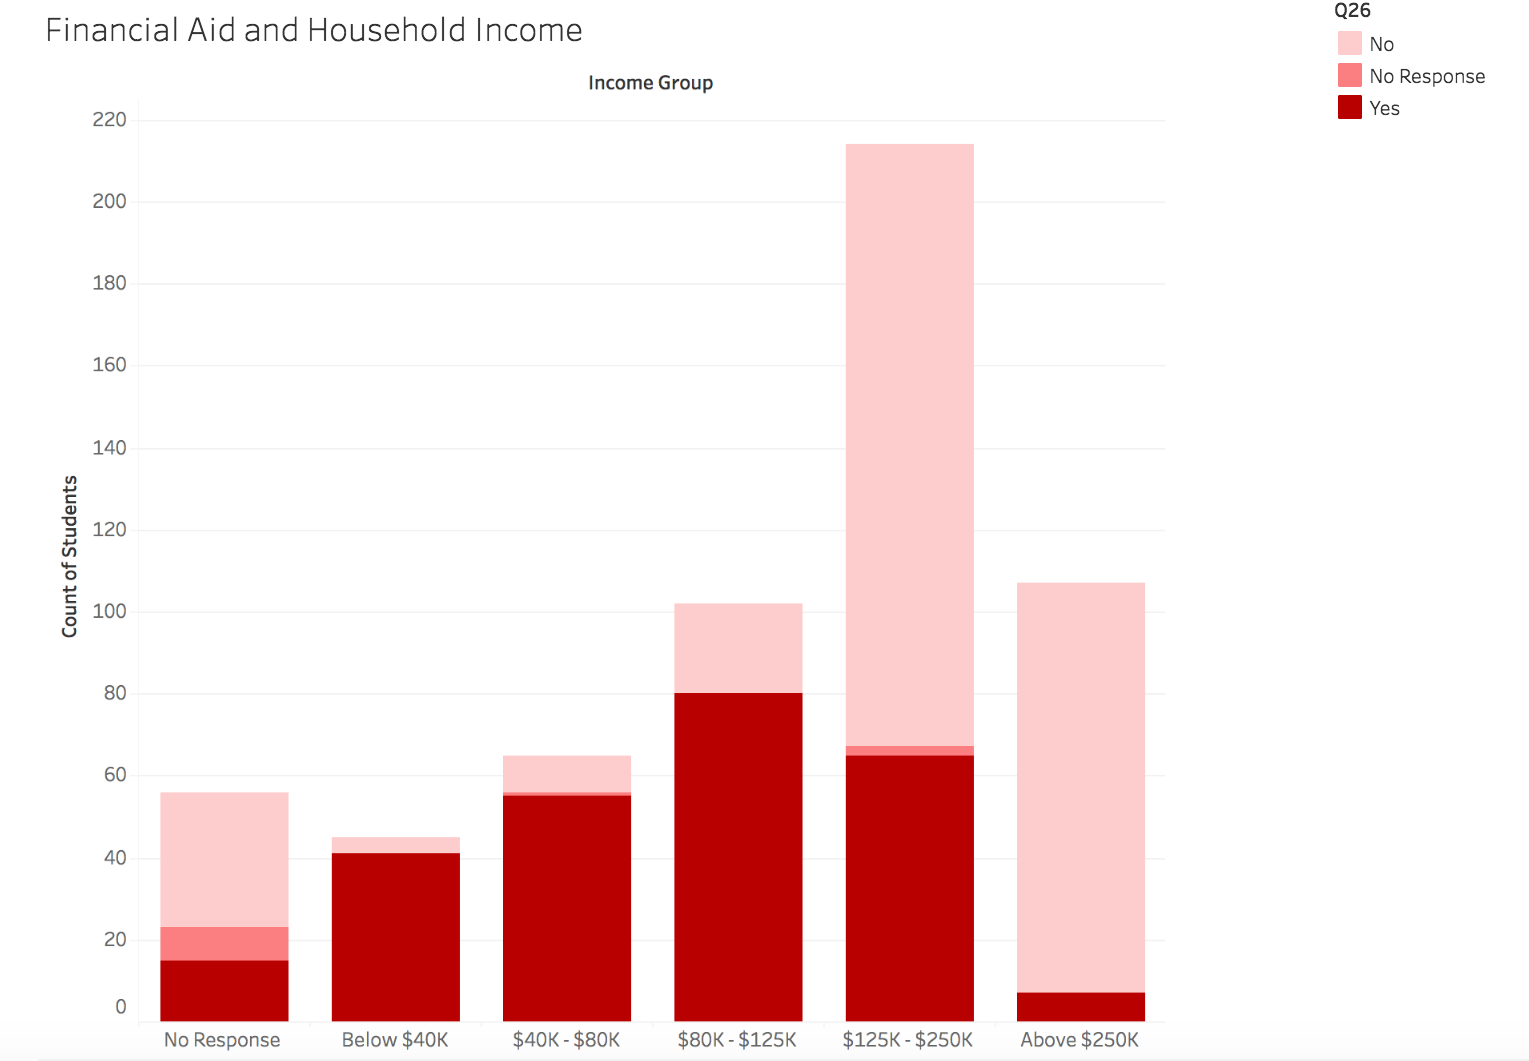
As expected, there is a clear correlation between lower income level and receiving financial aid. The overwhelming majority of students whose households earn less than $125,000 annually reported that they receive financial aid from the University, while just six percent of students whose households earn at least $250,000 said they benefit from financial aid.
Cornell reported that 43.6 percent of full-time, first-year students are receiving need-based grant aid from the University, which granted just above $40,000 on average to its financial aid beneficiaries.
Cornell Top Choice
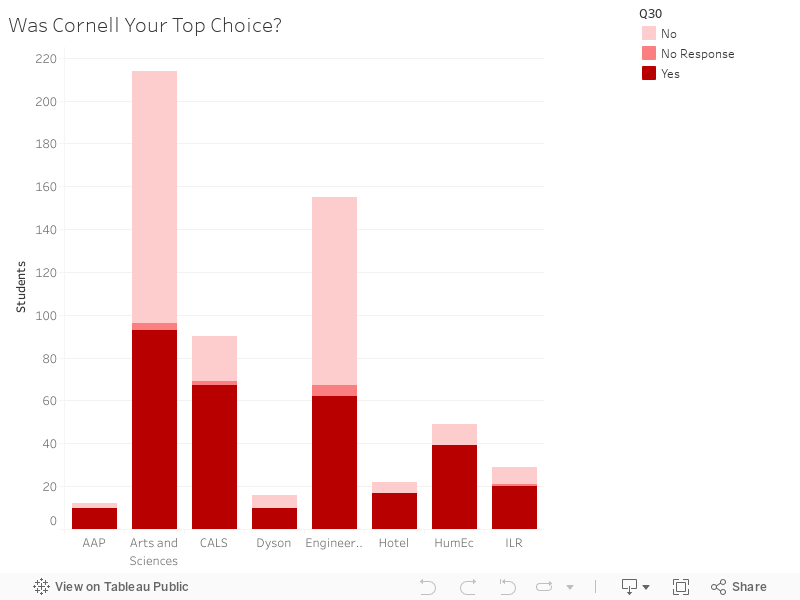
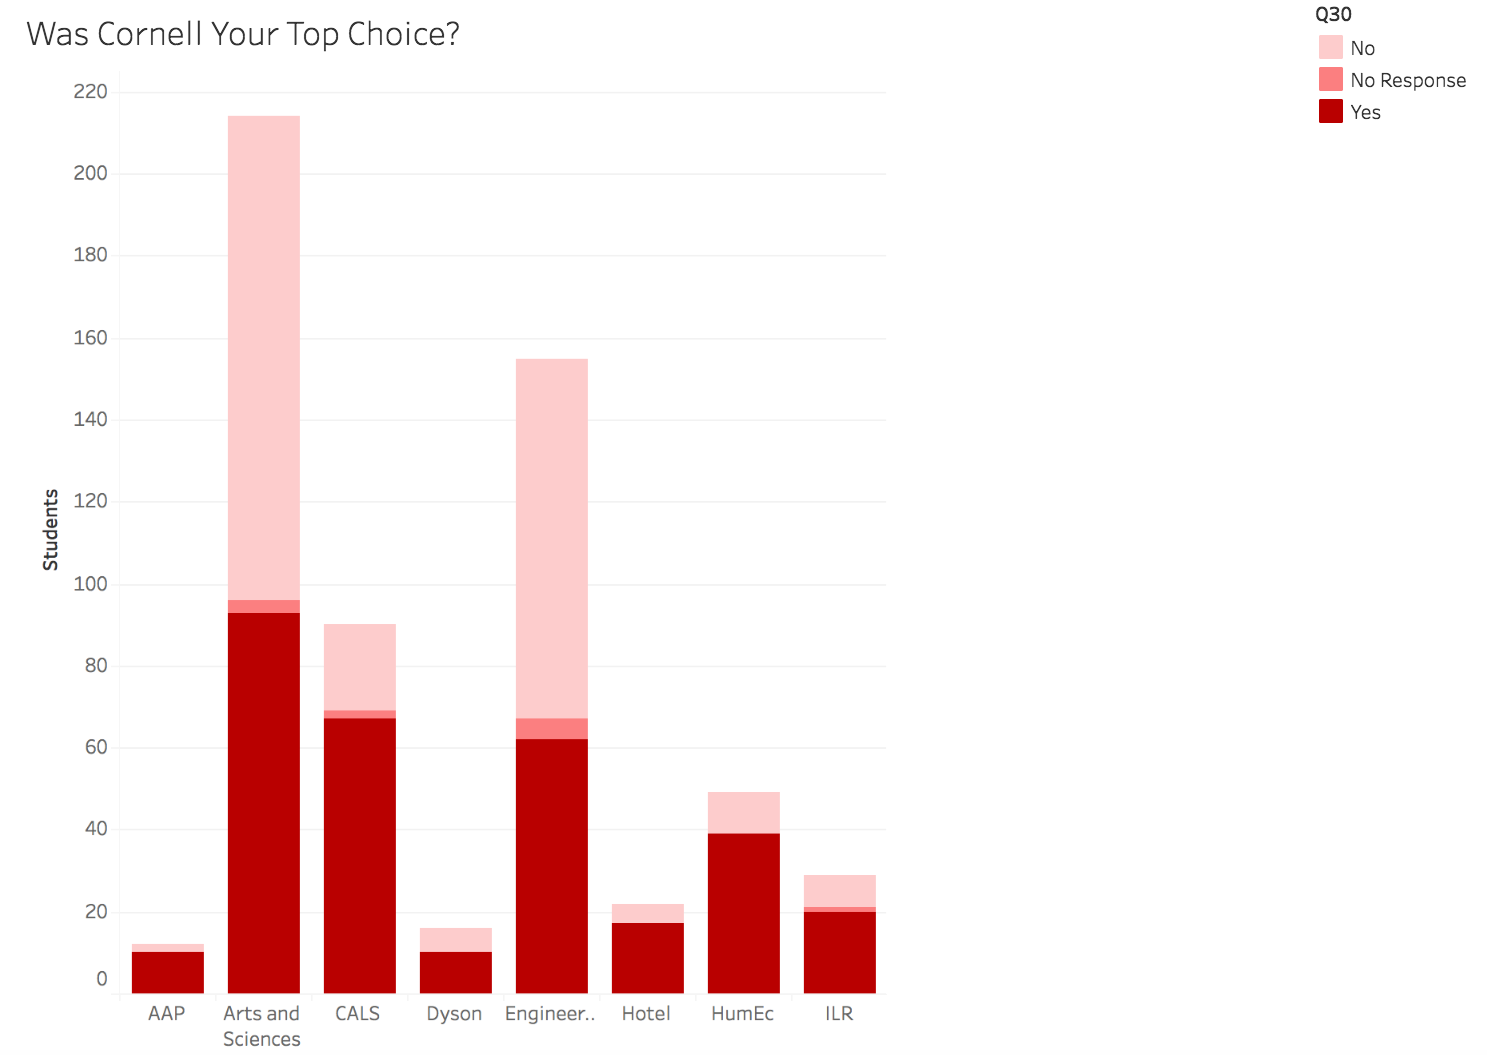
Despite the College of Arts and Sciences’s and the College of Engineering’s ability to boast about their selectivity, our data suggest that all five of Cornell’s other colleges can claim that the majority of their students actually wanted to attend their school above all others. The quality that most of those five of other colleges share is that they specialize in a particular area. The hotel school and the ILR school, for example, are some of the only schools of their kind in the country, and many of the other schools offer highly unique majors: urban and regional studies (AAP), fiber science and apparel design (Human Ecology), and food sciences (CALS). But the arts college and the engineering college may retain ultimate bragging rights, as they were the homes of two of Cornell’s most famous (and recently controversial) alumni: Supreme Court Justice Ruth Bader Ginsburg ’54 and “science guy” Bill Nye ’77, respectively.
Cornell Legacy and ACT Scores
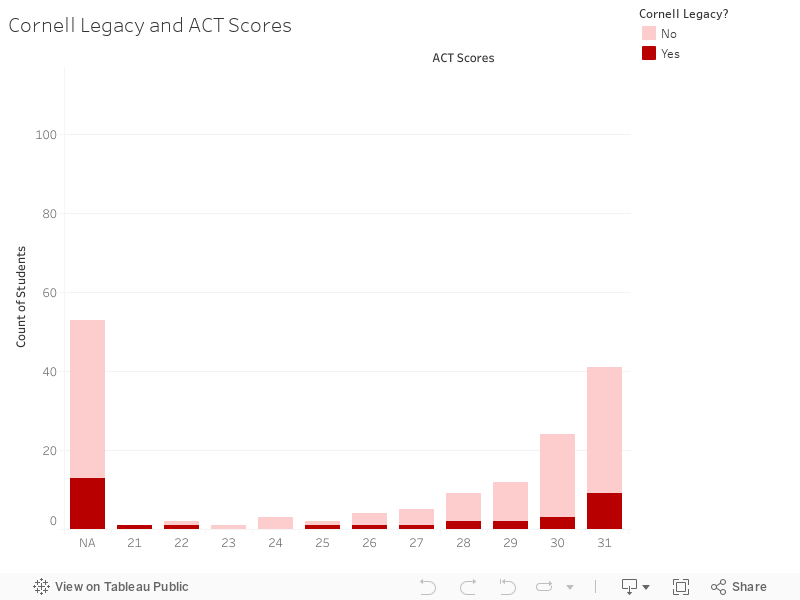
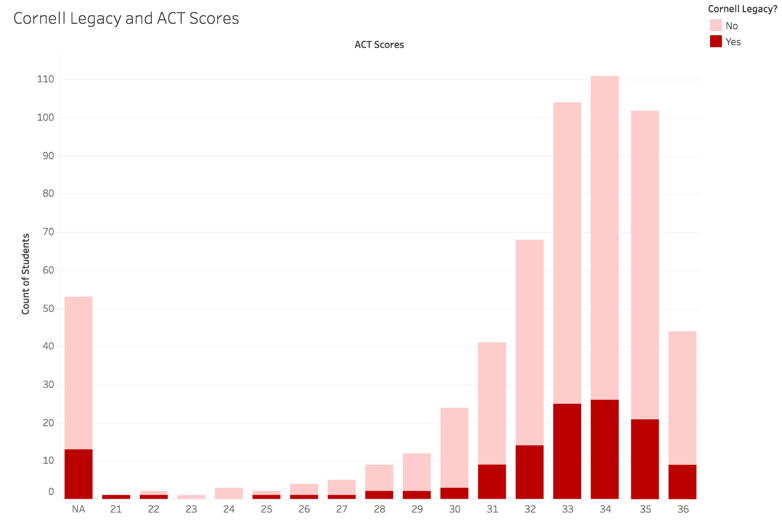
The ACT score distributions of legacies and non-legacies are remarkably similar; even the small differences between scores of legacies reflect in the scores of non-legacies. What’s more, if you crunch the numbers and compare the average ACT score of legacies versus that of non-legacies, you’ll see that they differ only by .06 points out of 36, with non-legacies winning the photo finish.